STEP09 Report - Alberta Tier-2
Introduction
The performance of the Alberta Tier-2 site during the STEP09 exercise is reviewed for the three Tier-2 functions of data distribution, monte carlo production and user analysis (glite WMS and panda pilot submissions) via HammerCloud.Data Distribution
During STEP09 the Alberta site requested a 25% share of the derived dataset distribution of ATLAS data (written to the ATLASDATADISK space token area). Such a value is larger than is planned for the steady-state Tier-2 operations model in the CA cloud where a smaller fraction would be subscribed to the Alberta site. Due to storage space constraints at two of the 4 CA Tier-2s the bulk of the subscriptions were targeted toward SFU (72%) and Alberta (25%). Concurrent with the distribution of ATLAS data to DATADISK was also the distribution of merge AOD samples to the MCDISK space token area. The Alberta share of the merge.AOD sample distribution is 15%. Figure 1 shows the ATLAS data distribution dashboard summary for the Alberta site for the STEP09 period. Figure 2 shows the daily growth profile for the Alberta DATADISK and MCDISK areas covering the STEP09 period as taken from the DQ2 Accounting webpages. Figure 3 shows the measured network throughput on the TRIUMF-to-Alberta 1 Gbps lightpath link. Changes to the FTS settings for transfers between TRIUMF and Alberta were made early on in the STEP09 period and significantly improved the dataset transfer completion and network utilization (see below for further discussion). The network throughput corresponding to a 25% share of data is 192 Mbps. Clearly early on in the STEP09 period measured throughputs were a factor of 2 below this at 100 Mbps, but changes to the FTS settings pushed the data transfer rate well above this afterward. Figure 1: Dataset and file transfer rates and errors during STEP09 Figure 2: DATADISK and MCDISK occupancy during STEP09
 Figure 3: TRIUMF-Alberta (T1-T2) Network Link Activity
  Several aspects of the Alberta site performance related to the data distribution exercise of STEP09 should be noted:
Dataset transfers to ALBERTA - update to FTS Settings (4 June 2009)
It was observed yesterday that nearly all of the dataset subscriptions to Alberta_DATADISK were remaining in a 'subscribed' state (red) rather than 'complete/done' (green) on the T1-T2 FT status pages for the past 24 hour period. This is although nearly 100% success was observed in dataset file transfers to Alberta from the dashboard. The majority of the datasets 'subscribed' to Alberta are stream datasets. Querying ADC Ops explained the difference between stream and other dataset handling. Further discussion at the morning ADC Ops meeting pointed toward a non-optimal FTS configuration for the TRIUMF-Alberta channel. The rate of transfer was approximately 100 Mbps at the time, far below the 1 Gbps capacity of the link.
Di at TRIUMF changed the FTS parameters from streams=2 and files=3 to streams=6 and files=4; the transfer rates increased roughly from 250Mb/s to 350Mb/s on average. Increasing them again to streams=7 and files=8, and transfer rates reached about 500Mb/s and some time even more.
The dCache setup at Alberta handled the new FTS channel settings nicely, with a per pool node load increase from less than 1 to around 2 - 3, and with +20% cpu utilization. (See Figure 10). An observed doubling in the sum inbound network traffic to the worker nodes (see Figure 11) occurred during the same period but did not show any effect upon analysis job efficiency. It was decided to keep the latest FTS settings for the next 24 hours or so to see if the backlog of 'subscribed' datasets could be reduced, which it did. Additional changes to the FTS settings to further improve network throughput were possible as the sending (TRIUMF) and receiving (Alberta) dcache services showed no problem in transferring at 600 Mbps.
Alberta PRODDISK and DATADISK - no space reported (7 June 2009)
Several aspects of the Alberta site performance related to the data distribution exercise of STEP09 should be noted:
Dataset transfers to ALBERTA - update to FTS Settings (4 June 2009)
It was observed yesterday that nearly all of the dataset subscriptions to Alberta_DATADISK were remaining in a 'subscribed' state (red) rather than 'complete/done' (green) on the T1-T2 FT status pages for the past 24 hour period. This is although nearly 100% success was observed in dataset file transfers to Alberta from the dashboard. The majority of the datasets 'subscribed' to Alberta are stream datasets. Querying ADC Ops explained the difference between stream and other dataset handling. Further discussion at the morning ADC Ops meeting pointed toward a non-optimal FTS configuration for the TRIUMF-Alberta channel. The rate of transfer was approximately 100 Mbps at the time, far below the 1 Gbps capacity of the link.
Di at TRIUMF changed the FTS parameters from streams=2 and files=3 to streams=6 and files=4; the transfer rates increased roughly from 250Mb/s to 350Mb/s on average. Increasing them again to streams=7 and files=8, and transfer rates reached about 500Mb/s and some time even more.
The dCache setup at Alberta handled the new FTS channel settings nicely, with a per pool node load increase from less than 1 to around 2 - 3, and with +20% cpu utilization. (See Figure 10). An observed doubling in the sum inbound network traffic to the worker nodes (see Figure 11) occurred during the same period but did not show any effect upon analysis job efficiency. It was decided to keep the latest FTS settings for the next 24 hours or so to see if the backlog of 'subscribed' datasets could be reduced, which it did. Additional changes to the FTS settings to further improve network throughput were possible as the sending (TRIUMF) and receiving (Alberta) dcache services showed no problem in transferring at 600 Mbps.
Alberta PRODDISK and DATADISK - no space reported (7 June 2009) - 4 small pools of the total of 6 on dCache became full ; subsequently marked read-only
- FTS transfers paused during error reporting period
- resulted in sites being added to Hammercloud blacklist
- requested removal (8 June 2009)
- later corrected at site (9 June 2009)
- Storage controller failed causing no access to LUNs on temporary pools mounted from WestGrid-UofA SAN - including ATLAS Tier2
- backlogs of data distribution to be cleared by 14 June 2100UT
- ALBERTA failed to achieve STEP09 data export metric for completion (less than 10 datasets left to be completed). See link
 for complete list of all sites that fit this category.
- ALBERTA details:
- Completed: 3000, Missing: 394
- Comments:
- SAN storage failure 12 June in the afternoon causing failed access to temporary pools on Westgrid-UA T2 storage system; no further writes to pools possible as others were full.
- FTS settings were updated 4 June and gave significant improvement for transfers compared to those earlier on during STEP09. Can they be further optimized?
- FTS Settings: concurrent files = 8, streams per file transfer = 7 (for approx. 600 Mbps)
Production and Analysis
The Alberta site uses torque + maui as the LRMS. The target shares between production, analysis (WMS) and analysis (panda pilots) for STEP09 were applied in advance of the exercise and checked daily for any problems, either in the targets not being met or if any negative impact on performance was occurring due to the settings (such as total number of jobs). Below is a snapshot as taken on June 4 showing the target and observed split between each of the job types at the Alberta site. Overall the maximum number of allowed jobs at the site was limited at approximately 115 due to the number of available WNs. The site experimented with setting of soft and hard limits on the number of allowed jobs of each type during STEP09 (to allow for increased usage of one job type while other job types may be using less than their baseline share) but these did not appear to be working correctly, so were reset such that the soft limit was the hard limit.Batch System Shares
Alberta               Jobs             Jobs     Share
                      Running ( %)     Queued   Target (%)
Production (panda)       53 ( 50%)       22      50
Analysis (WMS)           23 ( 22%)      218      25
Analysis (Panda)         30 ( 28%)       23      25
                        ----------
TOTAL                   106 (100%)

Comment: max number of running jobs = 115.
Since 20090530 have set soft limit on maxjobs of each analysis type at 30 (panda) and 25 (wms), production at 60.
Hard limit values are higher.
Based upon the data collected from the site torque accounting logs the number of running jobs of each type at the site as a function of time during STEP09 are shown in Figure 5. The average values are as expected based upon the torque settings. Figure 6 shows a stacked plot of the running jobs further demonstrating the total number of jobs running during STEP09.
Production
The Alberta site was very efficient both in terms of overall average successful job completion (90.7%) and average cputime to walltime efficiency (93.7%) as indicated in the production dashboard snapshot shown in Figure 4. Figure 4 The job efficiency (cputime to walltime ratio) as a function of time during the STEP09 exercise is shown in Figure 7.
Analysis
The final STEP09 Summary Results for the analysis jobs submitted to the Alberta site are given below. Overall the Alberta site was much more efficient for analysis pilot job submissions, both in terms of success rate and individual job cputime/walltime efficiency (see FIgure 7).
Figures 8 and 9 demonstrate the measured job throughput (= number of running jobs x the efficiency of those jobs) for each analysis job type. Higher throughput is observed for the Panda pilot analysis jobs.
| Cloud | Site | # Jobs | # Successful | # Failed | Efficiency | #files | #events | Hz | CPU/Wall |
|---|---|---|---|---|---|---|---|---|---|
| CA | ALBERTA-LCG2_MCDISK | 1081 | 876 | 205 | 0.810 | 5501 | 51921120 | 2.6 | 26.4 |
| CA | ANALY_ALBERTA | 4289 | 3869 | 420 | 0.902 | 13851 | 133317962 | 5.3 | 28.7 |
- blacklisted in ganga WMS analysis job submissions (see 0 jobs queued or running in Hammercloud snapshot table of 9 June 2009)
- this accounts for the gap of no running WMS jobs as seen in Figure 7 and Figure 8.
- job submission problems caused by BDII failure which was restarted in around 24 hours
- encountered by FTS transfers - later corrected at site [20090609]
WMS Analysis Jobs
On average the job efficiency (cputime/walltime) for WMS analysis jobs was approximately 20%. Job efficiencies as a function of data access method (dcap versus FileStager) cannot be determined from the local site logging information alone but would of course be worthwhile to know for the future Tier-2 deployments in Canada. The type and frequency of the failures encountered for the WMS analysis job submissions are linked in the table below. A detailed understanding of the reasons associated with the lower success rate compared to that seen with the pilot submissions is still under investigation.Errors at ALBERTA-LCG2_MCDISK
| Site | Exit Code (or Pilot Code) | Failure Type | # | Ex. Job |
|---|---|---|---|---|
| ALBERTA-LCG2_MCDISK | 0 | non-zero app. exit c | 203 | 426 207.0 |
| ALBERTA-LCG2_MCDISK | 0 | request expired | 2 | 428 522.20 |
Panda Analysis Jobs
On average the job efficiency (cputime/walltime) for Panda pilot analysis jobs was approximately 30%, higher than that for the glite WMS submissions. The type and frequency of the failures encountered for the Panda pilot analysis job submissions are linked in the table below.Errors at ANALY_ALBERTA
| Site | Exit Code (or Pilot Code) | Failure Type | # | Ex. Job |
|---|---|---|---|---|
| ANALY_ALBERTA | 0 | 17 | 1009092469 |
|
| ANALY_ALBERTA | 0 | Adder._updateOutputs | 30 | 1009057681 |
| ANALY_ALBERTA | 0 | job recovery failed | 51 | 1009415125 |
| ANALY_ALBERTA | 0 | Put error: Copy comm | 1 | 1010068876 |
| ANALY_ALBERTA | 1100 | Get error: Replica w | 307 | 1009646549 |
| ANALY_ALBERTA | 1106 | Payload stdout file | 1 | 1010826047 |
| ANALY_ALBERTA | 1156 | Copy command returne | 10 | 1010068884 |
| ANALY_ALBERTA | 1156 | Globus system error: | 1 | 1010136482 |
| ANALY_ALBERTA | 1179 | Get error: Failed to | 2 | 1009465675 |
Conclusions
- data distribution proceeded well following improvements in the FTS settings for the T1-T2 transfers. The SAN failure prior to the end of STEP09 prevented a complete catch-up of the dataset distribution backlog. Otherwise the new FTS settings seemed sufficient but had room for further improvement with no negative impact upon the other T2 site functions (such as analysis) given the smaller number of WNs in the current Tier-2.
- Overall the production proceeded as expected.
- For user analysis the Panda pilot jobs had a higher success rate (above 90%) and were additionally more efficient per job. The job success rates could have been slightly higher still if not for the SAN failure which prevented read access to many required input files on dcache.
- improvements are foreseen overall for the Alberta Tier-2 capability as it is transitioning to new hardware in the next 1 to 2 months. This will give better network access to each of the dcache pool nodes from the cluster WNs (4 Gbps to each of two pools compared to 1 Gbps to all four current pools in the STEP09 setup). The new Tier-2 cluster will also present additional challenges in terms of job scheduling as it will be very much a shared environment with non-ATLAS users (much like is and will be the case with the SFU Tier-2 site).
- A repeat of similar tests with the new Tier-2 hardware over the summer would be beneficial to further tune the site analysis and data distribution capabilities, and decide on the most appropriate data access protocols (dcap versus Filestager for example) and to test the dcache setup at scale.
Site Tasks for Follow-up
- WMS failed job follow-up and details
- Pilot jobs - why not as success as SFU, for example?
- Storage services
- tune for max transfer from T1 at 1Gbps
- details of SAN failure from Westgrid-UA
- stream v closed datasets as a fnc of time (Bryan for central distribution point-of-view)
- scrutinize new T2 dcache design and setup
Figures
Figure 5: Running jobs Figure 6: Running jobs (cumulative)
  Figure 7: Job Efficiency (cputime/walltime)
 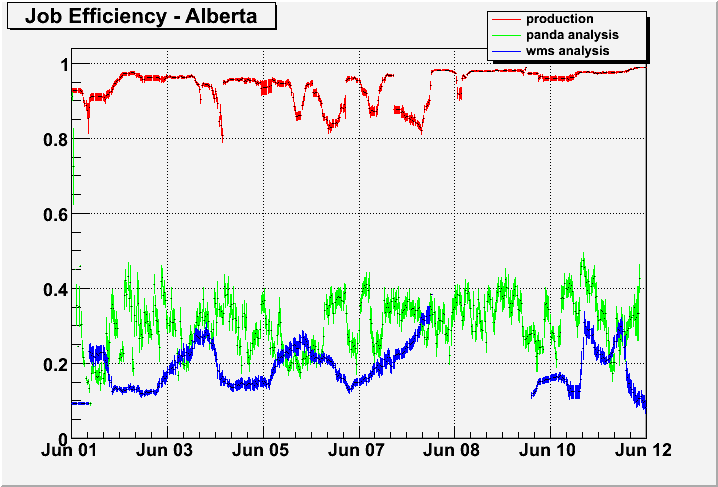 Figure 8: Job Throughput
  Figure 9: Job Throughput (cumulative)
  Figure 10: Ganglia Plots for LCG Service Nodes (including dCache) during STEP09
  Figure 11: Ganglia Plots for WNs during STEP09


This topic: AtlasCanada > WebHome > GridActivities > ATLASCanadaTier-2Operations > Step09 > Step09SiteReports > AlbertaStep09Report
Topic revision: r6 - 2009-07-14 - BryanCaron

 Copyright © 2008-2026 by the contributing authors. All material on this collaboration platform is the property of the contributing authors.
 Ideas, requests, problems regarding TWiki? Send feedback